
This article was originally published in the European Actuary in December 2025.
https://actuary.eu/wp-content/uploads/2025/11/TEA-44-Corporate-bond-credit-transition-risk.pdf
One of the most material risks for life insurance companies is associated with corporate bond transition and default risk. Life insurers hold material amounts of corporate bonds and the risks of default or credit rating downgrade pose a risk to the balance sheet.
Credit risk can manifest on both sides of an insurers’ balance sheet – asset side (through credit risky assets) and liability side(where insurers take credit for the spread over risk free on credit risky assets when discounting their liabilities). In capital management, the way capital requirements measure credit risk is typically anchored in credit ratings and hence transition risk is of high importance in capital modelling.
The primary tool for modelling defaults and downgrades is the transition matrix. Transition matrices are used to capture probabilities of transitioning between credit ratings and to default (an absorbing state). They are produced from the number of corporate bonds that moved between credit ratings or defaulted over a given time period.
S&P average transitions from 1981-2018 (source S&P Global Default Study 2019)
The transition matrix itself is the data item that is being modelled. A historical time series of transition matrices can be obtained to gain an understanding of the risk. Each matrix is itself 7*7 data points; the complexity of this data source makes transition and default risk one of the most complex risks to model.
In a stress position there needs to be some model for stressing a transition matrix to capture more extreme events than the long term average matrix. Ideally a model would be able to provide a full risks distribution of transition matrices at any percentile required.
A 2023 paper by the UK IFoA Extreme Events working party investigated four credit transition risk models.[1]
Some of the main uses transition risk models are:
Solvency II
On the asset side, to model corporate bonds in stress, there needs to be an allowance for stressed transitions and defaults.
On the liability side, in the UK and Spain, the matching adjustment is commonly used; elsewhere in Europe the dynamic volatility adjustment in stress is used. In either case, movements in bond spreads affect both assets and liabilities. However, while the liability spread is based on a reference portfolio of defined credit quality, the asset spread is a function of the chosen asset portfolio. Downgrades in the assets held then affect the asset spread but not the liability spread, resulting an in asset-liability mismatch.
For internal models in stress, a probability distribution of transition matrices is required for the fundamental spread. This is to capture the stress position at a 1-in-200 position but also in any given biting scenario - as well as the full risk distribution of fundamental spreads.
IFRS 17
For default and downgrade models using an historical calibration a transition matrix can be used. IFRS 17 default models require an allowance for both expected and unexpected defaults. The expected default allowance can be found by just powering up a base transition matrix, but the unexpected default allowance would be expected to be taken from a matrix stressed to a particular percentile.
The Vasicek model
One of the most commonly used models for default and transition risk is the Vasicek model, also known as the credit-metrics approach. Vasicek’s model is based on a structural approach where the assets of bond issuers are log-normally distributed. Any two assets are correlated with a single correlation factor ρ (rho) using a Gaussian copula. Generally, Vasicek’s model produces good years (positive optimism) with many upgrades compared to downgrades, and bad years where the reverse applies.
This model is used widely through the insurance and banking industry.
Two factor model
The Two factor model takes two features from the transition matrix and models them statistically using probability distributions and a copula.
Inertia – the sum of the probabilities across the leading diagonal (i.e. the sum of the combined probabilities of not changing rating).
Optimism – the weighted ratio of upgrades to downgrades, where the weighting can be chosen by the modeler – for example according to the market value of assets in the portfolio by rating.
Each historical transition matrix has a value for these factors, and so probability distributions can be fit to historical data and combined using a copula. This can be used to calibrate a model for transition matrices at any percentile. A 7x7 transition matrix is not mathematically determined by its optimism and inertia alone, so some from of components analysis is required to construct full matrices from simulate optimism and inertia values.
Vasicek’s model models optimism but not inertia, contrary to empirical analysis which reveals that inertia has historically been the more significant factor. Allowing for inertia allows insurers to capture some diversification between upgrades and downgrades in low-inertia years when both forms of transition occur simultaneously.
Bootstrapping
The bootstrapping model refers to the approach of repeatedly sampling from the original data set with replacement.
This is a very simple non-parametric model and the main benefit of being true to the underlying data without many expert judgements and assumptions(aside the choice of data). A downside of this model is it cannot produce scenarios worse than the worst event seen in history; this means it is unlikely to be useful for Economic Capital models where the extreme percentiles are a crucial feature of the model. Nevertheless this model is included for comparison purposes as it is very close in nature to the underlying data.
K-means model
The K-means model involves grouping historical transition matrices (using the K means grouping algorithm) into a smaller number (e.g. eight) of representative transition matrices. These transition matrices are each allocated a percentile, and other percentiles are found by interpolating between the matrices.
The aim of this approach is to overcome issues with bootstrapping – so that more extreme percentiles than the worst transition matrix can be given; as well as having a smooth interpolation between percentiles.
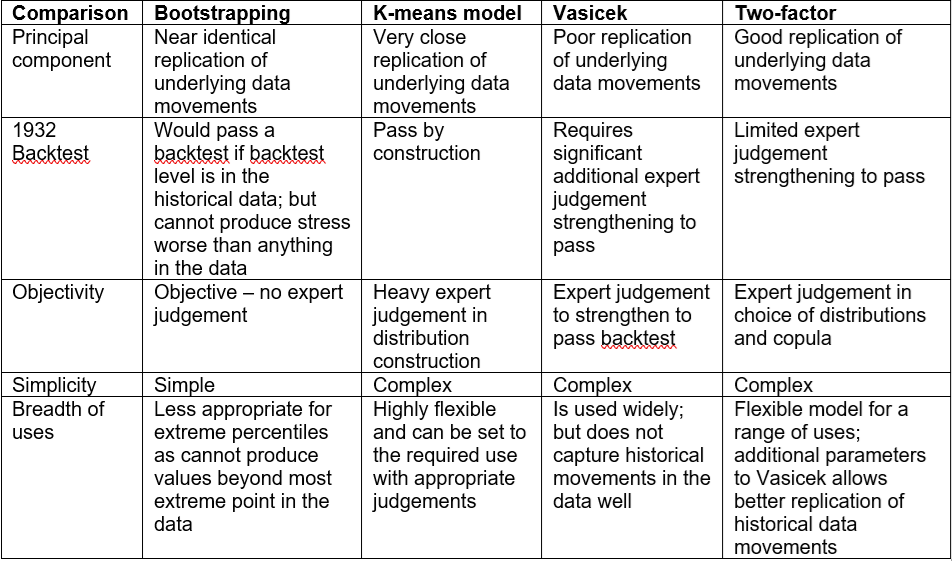
The Vasicek model is the most commonly used credit transition and default model used by insurers and banks. However, it comes with some significant issues in replicating the underlying data it is calibrated to. There are other parametric and non-parametric that are well worth investigating.
[1] “Calibration of Transition Risk for Corporate Bonds” J. Sharpe, F. Ginghina, G. Mehta and A.D. Smith, British Actuarial Journal (2023),Vol.28, e8,pp.1–28
